A little while ago I posted a video of some rather peculiar algo activity here. I was asked a question about what the yellow bars at the right hand side of the chart were and how to get them. They are CTS T4 Trade History. The CTS T4 Trade History is very basic and simply shows any change in price. It can be a nice gauge of current activity at a particular price level/price zone of interest.
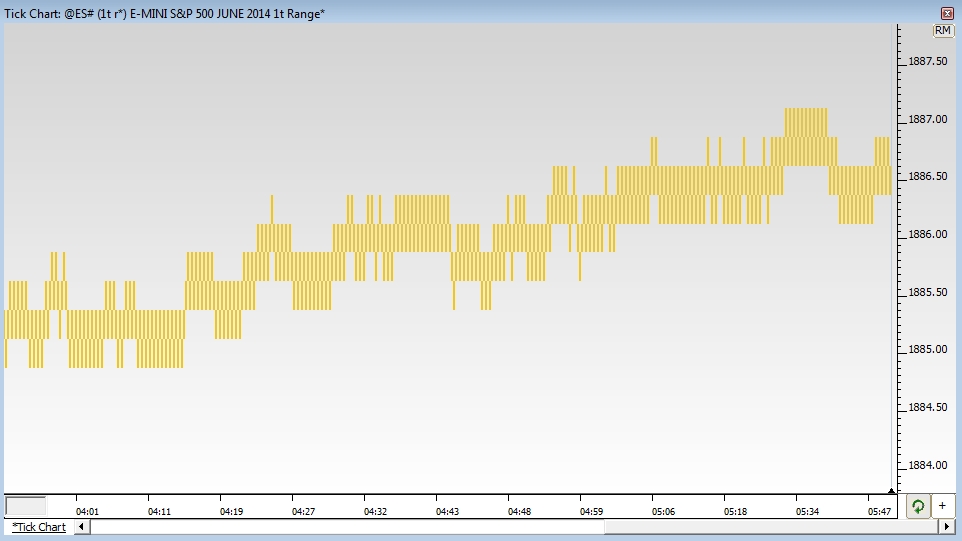
A tick up prints a block and a tick down prints a new one. Multiple ticks at the same price don’t generate new blocks unless a trade goes through at a different price first. So for the example sequence of trades 1886.25, 86.50, 86.50, 86.75, 86.75, 86.75, 86.50, 86.75 – the Trade History would print single blocks in the order 1886.25, 86.50, 86.75, 86.50, 86.75.
You may or may not find it useful, but it’s worth having a play with as it can help with seeing the immediate activity. If you don’t have T4, I’ve replicated the tool in an IRT chart. Here’s the dropbox definition file link: –